

Students call "foul": Study finds bias in football rulings on the field
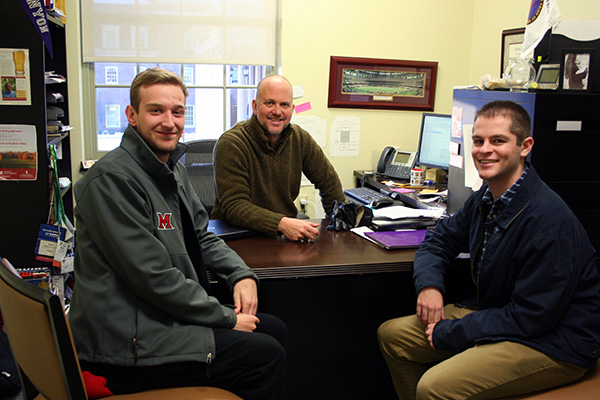
Mike Macey, Rhett Brymer and Mickey Whitford analyzed football referee play calls looking for incidents of potential bias.
By Elizabeth Jenike, Farmer School of Business
When you’re a frustrated football fan, one of the phrases you probably utter the most is, “Come on, ref!” Rhett Brymer, the John Mee Endowed Assistant Professor of Management, and undergraduate students Mickey Whitford and Mike Macey are no different — except for the fact that they have access to big data analytics tools and the skills to use them.
In 2013, Brymer decided that sitting on the sidelines as a football fan wasn’t going to cut it, so he set out to find what, if any, biases existed in college football officiating. He started sorting through mountains of footage from 2005 to 2012. This study was presented at the MIT Sloan Sports Analytics Conference, and Bloomberg contributor Bryan Gruley picked up the story.
It turns out there’s more than one way to determine bias in referees. The traditional way, which is used by the NCAA officiating teams, is for monitors to view game film and judge how good or bad certain calls are and see if there are any systemic biases, such as referees throwing games or tournaments. The second way, which Brymer ascribed to, was to use data analysis to make the same determinations.
Most recently, he began to collect data on the years from 2012 to 2015. This came out to more than 38,000 individual observations put into one Excel sheet. Each observation represented an instance where a foul was called on the field. As you can probably imagine, this was a huge amount of data.
Here’s where Whitford and Macey got involved. They took a data analysis course in spring 2015 with Waldyn Martinez, assistant professor of information systems and analytics. Martinez mentioned Brymer’s research as a way that data analytics can be applied to the real world, and the students’ ears perked up.
Macey (a senior accountancy and analytics double major) had just told Whitford (a senior supply chain and operations management and analytics double major) the day before that he wanted to do some sort of analytics project, and Whitford had just thrown around the idea of doing something in sports analytics. So, this project seemed too serendipitous to pass up. They got in touch with Brymer, and the rest, as they say, was history.
Finding the right model
The students’ main task was to take the data — the incredible 38,000+ observations —and turn it into something readable. The analysis itself took them close to nine months.
“Mickey and Mike did the heavy lifting,” Brymer said. “They’re doing this for no class credit, no pay,” he noted.
“Once we got the finalized model, it was all about making it more interpretable and including the right parameters, such as year or performance,” Whitford said. “We did a lot of the computation and data analysis, and then Dr. Brymer wrote the article and made sense out of the numbers.”
One of the biggest findings of Brymer and the students was that on average, referees are ten percent less likely to throw discretionary flags (for fouls like holding, unsportsmanlike conduct, pass interference or personal fouls) on teams more likely to go to the playoffs or that have winning traditions. Brymer, Whitford and Macey found that these teams, which they called “protected flagships,” did especially well in the Big Ten conference.