
Miami's plant scientists use the glowing properties of plant cells to turn a problem into a benefit for plant microscopy
Stunning images are created in the process
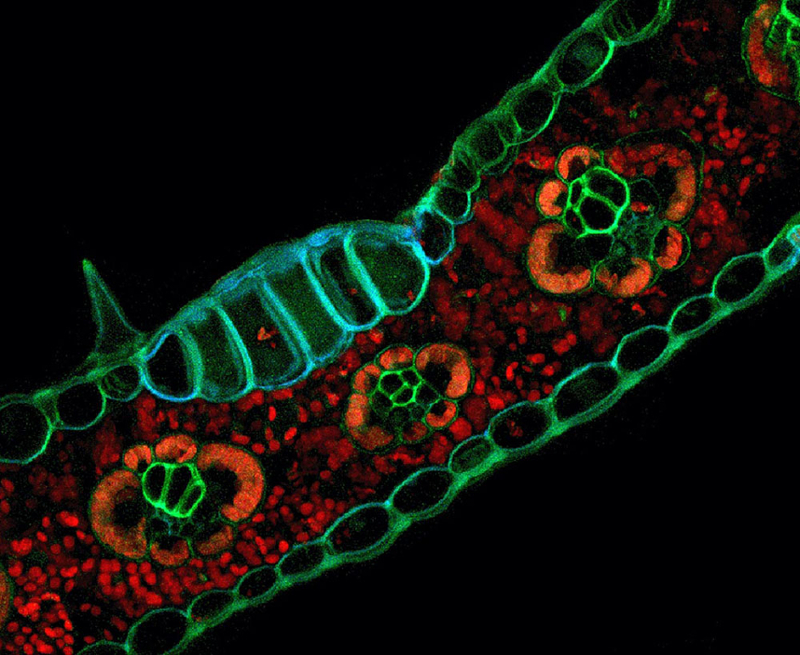
This microscopic image of the autofluorescence pattern of Zea mays (corn) tissues was used as the cover image of the journal Applications in Plant Sciences.
By Susan Meikle, university news and communications, Rob Baker, department of biology, and Jerald Pinson, Applications in Plant Sciences
Taking something most people consider a problem in plant microscopy and using it to create a research protocol for vastly increasing the speed of the entire process is the focus of a recent study published by Timothy Pegg (Miami Ph.D. '21) and colleagues in Miami University's department of biology.
Pegg developed a method that eliminates the need for the time-intensive plant specimen staining process by tapping into the natural autofluorescence of tissues in species across the plant tree of life.
Their study, Algae to angiosperms: Autofluorescence for rapid visualization of plant anatomy among diverse taxa, with lead author Pegg, senior author Rob Baker, assistant professor of biology, and co-author Dan Gladish, professor of biology and of biological sciences, was published in the journal Applications in Plant Sciences.
The problem: How to reduce the time and labor involved to produce microscopic data in plants?
Baker said:
"Techniques for measuring plant traits have not been advancing at nearly the pace that genetic technology has. There have been major advances in robotics and remote sensing - but relatively little in terms of internal anatomy, which has always been a labor and time intensive process.
We sought to close that gap by exploring techniques for rapidly producing microscopic data in plants.
One of Tim’s major insights is that we could use something most people consider a problem in plant microscopy - autofluorescence - to our advantage."
What is autofluorescence?
When certain tissue types in both plants and animals absorb light, electrons in their atoms get a jolt of energy that bumps them into an excited state. In plant leaves, these electrons become so unstable that they break free from their atoms and are used by the plant to power photosynthesis. In other tissues, the excess energy is re-emitted in the form of low-frequency light bright enough to be detected with specialized microscopes.
Autofluorescence hasn’t always been viewed as a good thing. In cases where researchers have to use stains to visualize specific structures, the light-emitting properties of nearby tissues can interfere by decreasing the contrast between different cell types. Up until now, however, researchers have lacked a one-size-fits-all protocol for detecting autofluorescent light in plants. The lack of a unified, standard approach is understandable, given there are nearly half-a-million living species of land plants and algae.
Insight led to simple, faster protocol

Comparison of different fixation treatments in Volvox (green algae, top) and Zea mays leaf tissue (bottom).
"Since we were interested largely in cellular and sub-cellular structures, Tim was able to use some of the advanced microscopes at Miami's Center for Advanced Microscopy and Imaging (CAMI) to isolate this autofluorescence and use it to look at cell walls, nuclei, chloroplasts and other structures," Baker said.
Pegg took this a few steps further by testing out various chemical fixatives to enhance the autofluorescence.
He worked out some very simple, clean protocols that are fast and easy to employ.
"Our simple sample preparation technique can cut down on the amount of time researchers need to spend visualizing samples on advanced microscopes,” Baker said. "In the future, we expect that our protocol will help people more easily make connections between genetic datasets and plant anatomy."
Study was a synergy between teaching and research
"One of the cool things about this study is that our sampling scheme was very much tied to the BIO 314 course I taught in 2020, Plant Diversity," Baker said.
"We had plant samples from across the plant kingdom from the class labs to test Tim’s protocols on — everything from green algae to flowering plants, representing perhaps 400 million years of evolutionary history.
It ended up being a wonderful example of the synergisms between teaching and research. And, of course. I make liberal use of Tim’s microscopy images in my classes now," Baker said.
Pegg, now a visiting assistant professor of botany at Marietta College, said, "our work provides a cost-effective, generalized protocol for plant sample preparation and visualization that is equally applicable to large research institutions and smaller plant science groups."
Full caption for banner image:
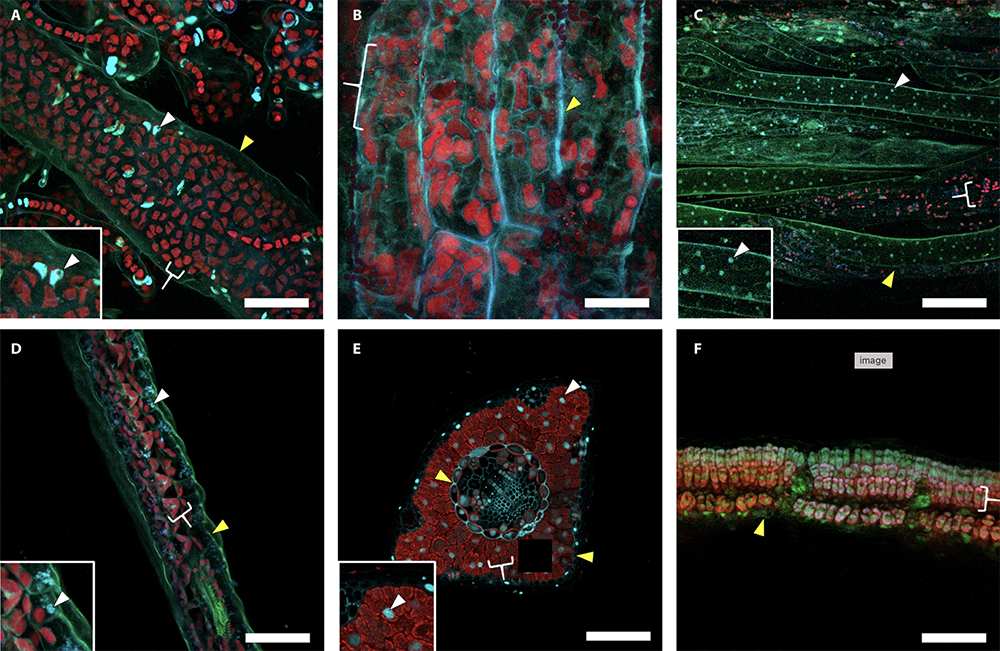
Comparison of fixative treatments among representative taxa. Images show results of fixation with 1% paraformaldehyde and 2% glutaraldehyde for (A) Ulva sp. (sea lettuce) thallus and protonemal section with insert highlighting a nucleus, (B) Chara sp. (type of green algae) stipe longitudinal section, (C) Marchantia sp. (liverwort) thallus and rhizoid section with insert highlighting a nucleus, (D) Selaginella (spikemoss) sp. microphyll cross section with insert highlighting a nucleus, (E) Pinus strobus (white pine) needle cross sections with insert highlighting a nucleus, and (F) Glycine max(soybean) leaf cross section. False-color represents cell walls (green), nuclei (blue), and chlorophyll (red). Cell walls, nuclei, and chloroplasts are indicated by yellow wedges, white wedges, and white brackets, respectively. Scale bars = 50 µm.