Ability to Be Hired
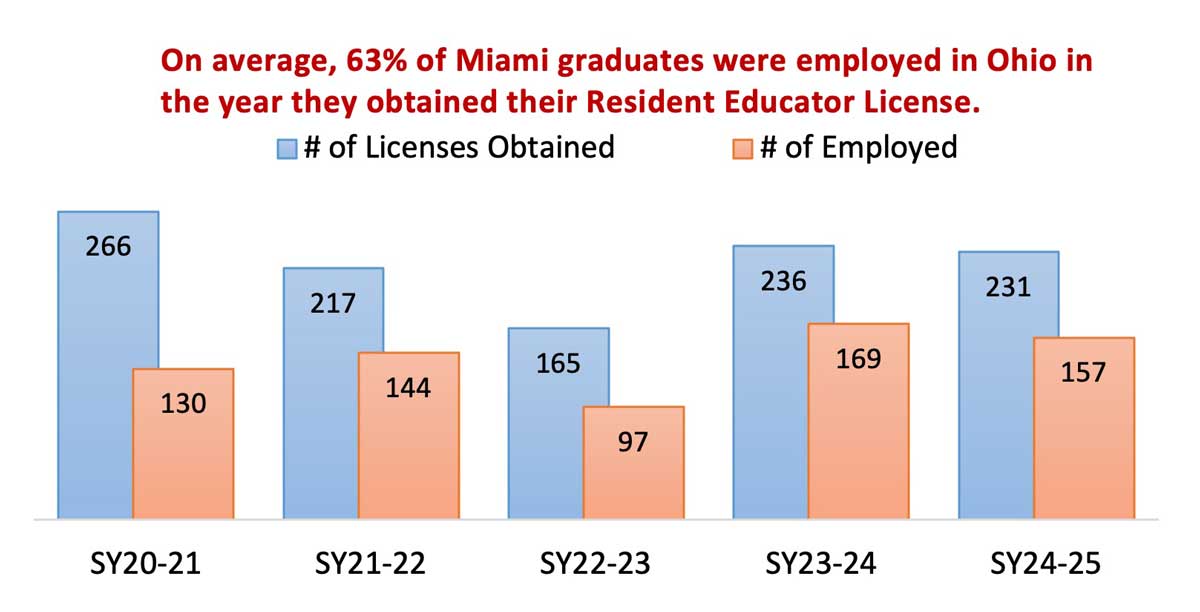
- For Miami graduates with Resident Educator Licenses that became effective in Year 2021,
- 66% were employed in Ohio schools in SY 2021-2022,
- 67% were employed in Ohio schools in SY 2022-2023,
- 64% were employed in Ohio schools in SY 2023-2024, and
- 60% were employed in Ohio schools in SY 2024-2025.
- For Miami graduates with Resident Educator Licenses that became effective in Year 2022,
- 59% were employed in Ohio schools in SY 2022-2023,
- 64% were employed in Ohio schools in SY 2023-2024, and
- 60% were employed in Ohio schools in SY 2024-2025.
- For Miami graduates with Resident Educator Licenses that became effective in Year 2023,
- 72% were employed in Ohio schools in SY 2023-2024 and
- 71% were employed in Ohio schools in SY 2024-2025.
- For Miami graduates with Resident Educator Licenses that became effective in Year 2024,
- 68% were employed in Ohio schools in SY 2024-2025 (Table 2 and Figure 1).
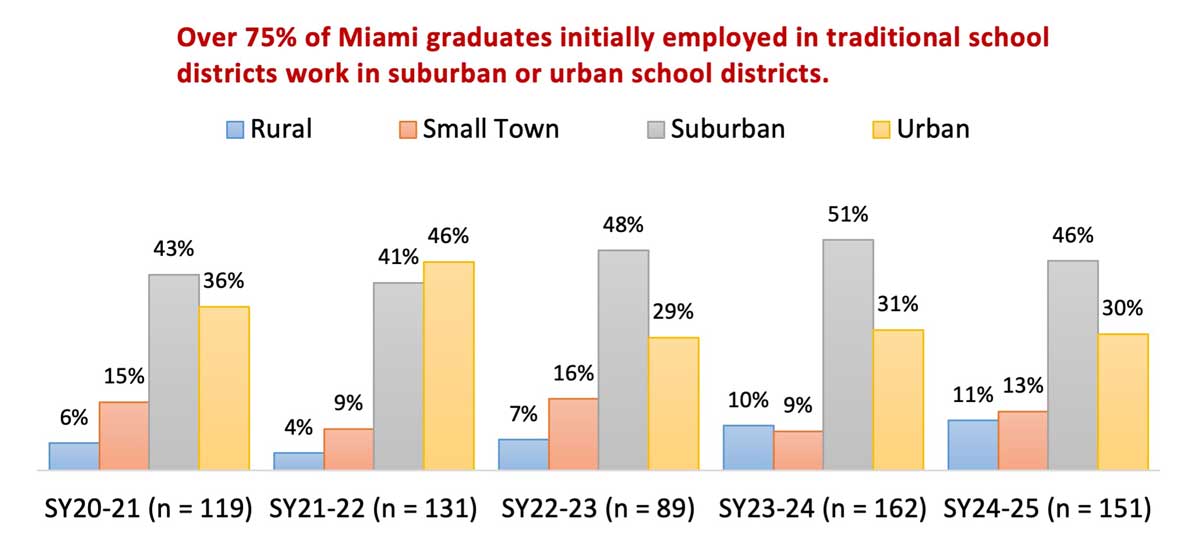
- For SYs 2020-2021 to 2024-2025, over 93% of Miami graduates employed in Ohio schools during the year their Resident Educator licenses became effective worked in traditional public school districts (Table 3).
- For Miami graduates with licenses effective 2020-2024 working in traditional public school districts, 4%-11% initially worked in rural districts, depending on the school year, 9%-16% worked in small town districts, 41%-51% in suburban districts, and 29%-46% worked in urban districts (Table 4 and Figure 2).
- Between 64% and 69% of Miami graduates with licenses effective 2020, 2021, 2022, 2023, and 2024 initially worked in school districts in Southwest Ohio (Table 5 and Figure 3).
- In SY 2024-2025, 25 Miami graduates with licenses effective 2021, 2022, 2023, or 2024 worked in the Cincinnati Public School District (CPS, Figure 3).
- Approximately 43%-56% of Miami graduates initially were employed in high-need schools in each of the SYs 2020-2021 to 2024-2025 (Table 6).
- When comparing Miami graduates with all educators who hold RE licenses across Ohio, 67% of Miami graduates with licenses effective 2021, 2022, 2023 or 2024 served in schools with medium-high or high percentages of minority students during SY 2024-2025, which was higher than the statewide percentage of 50% (Table 7). Further, 41% of Miami graduates served in schools with medium-high or high poverty levels during SY 2024-2025 (Table 8), which was similar to the statewide percentage of 46%.
- For Miami graduates with RE licenses effective 2020 who were employed in Ohio in SY 2020-2021 (n = 130), on average, 86% were employed in Ohio in each of the next three school years (SYs 2021-2022 through 2023-2024), calculated separately by year (i.e., teachers were not required to be continuously employed across all years). Additionally, 79% of educators were employed in Ohio in SY 2023-2024 (n = 103), with percentages ranging between 65% [Multi Age (P-12) licenses] and 88% [Early Childhood (P-3) licenses], (Table 9).
- For Miami graduates with RE licenses effective 2021 who were employed in Ohio in SY 2021-2022 (n = 144), on average, 81% were employed in Ohio in the next three years (SYs 2022-2023 through 2024-2025), calculated separately by year. Additionally, 74% of educators were employed in Ohio in SY 2024-2025 (n = 107), with percentages ranging between 57% [Multi Age (P-12) licenses] and 87% [Intervention Specialist (K-12) licenses], (Table 10).
- For Miami graduates with RE licenses effective 2022 who were employed in Ohio in SY 2022-2023 (n = 97), on average, 89% were employed in Ohio in the next two school years (SYs 2023-2024 and 2024-2025), calculated separately by year. Additionally, 86% of educators were employed in Ohio in SY 2024-2025 (n = 83), with percentages ranging between 73% [Primary (P-5) licenses] and 100% [Middle Childhood (4-9) licenses], (Table 11).
- For Miami graduates with RE licenses effective 2023 who were employed in Ohio in SY 2023-2024 (n = 169), 92% were employed in Ohio in SY 2024-2025 (n = 155), with percentages ranging between 86% [Intervention Specialist (K-12) licenses] and 100% [Early Childhood (P-3) licenses], (Table 12).
| License Type | % Employed in 2020-21 | % Employed in 2021-22 | % Employed in 2022-23 | % Employed in 2023-24 | % Employed in 2024-25 |
|---|---|---|---|---|---|
| License Effective Year - 2020 (N=266) | |||||
| Early Childhood (P-3) | 41% | 58% | 60% | 58% | - |
| Middle Childhood (4-9) | 45% | 57% | 57% | 57% | - |
| Adolescence to Young Adult (7-12) | 50% | 62% | 62% | 60% | - |
| Multi-Age (P-12) | 453% | 58% | 58% | 47% | - |
| Intervention Specialist (K-12) | 63% | 63% | 58% | 53% | - |
| Total | 49% | 59% | 59% | 56% | - |
| License Effective Year - 2021 (N=217) | |||||
| Early Childhood (P-3) | - | 65% | 68% | 65% | 65% |
| Middle Childhood (4-9) | - | 75% | 69% | 59% | 56% |
| Adolescence to Young Adult (7-12) | - | 61% | 63% | 61% | 54% |
| Multi-Age (P-12) | - | 56% | 52% | 48% | 44% |
| Intervention Specialist (K-12) | - | 79% | 83% | 86% | 76% |
| Total | - | 66% | 67% | 64% | 60% |
| License Effective Year - 2022 (N=165) | |||||
| Early Childhood (P-3) | - | - | 56% | 60% | 53% |
| Middle Childhood (4-9) | - | - | 50% | 56% | 56% |
| Adolescence to Young Adult (7-12) | - | - | 56% | 58% | 56% |
| Multi-Age (P-12) | - | - | 58% | 58% | 53% |
| Intervention Specialist (K-12) | - | - | 76% | 80% | 84% |
| Primary (PK-5) | - | - | 58% | 74% | 63% |
| Total | - | - | 59% | 64% | 60% |
| License Effective Year - 2023 (N=236) | |||||
| Early Childhood (P-3) | - | - | - | 50% | 50% |
| Middle Childhood (4-9) | - | - | - | 80% | 83% |
| Adolescence to Young Adult (7-12) | - | - | - | 67% | 71% |
| Multi-Age (P-12) | - | - | - | 70% | 73% |
| Intervention Specialist (K-12) | - | - | - | 75% | 64% |
| Primary (PK-5) | - | - | - | 72% | 70% |
| Primary Intervention Specialist (P-5) | - | - | - | 0% | 0%* |
| Total | - | - | - | 72% | 71% |
| License Effective Year - 2024 (N=231) | |||||
| Early Childhood (P-3) | - | - | - | - | 0%** |
| Middle Childhood (4-9) | - | - | - | - | 62% |
| Adolescence to Young Adult (7-12) | - | - | - | - | 54% |
| Multi-Age (P-12) | - | - | - | - | 69% |
| Intervention Specialist (K-12) | - | - | - | - | 85% |
| Primary (PK-5) | - | - | - | - | 70% |
| Primary Intervention Specialist (P-5) | - | - | - | - | 100% |
| Total | - | - | - | - | 68% |
|
Note. Data in this table reflects the number of educator licenses, not the number of educators. Educators may hold more than one valid license. Only one educator received a Primary Intervention Specialist license in 2023; this individual was not employed during the 2023-2024 or 2024-2025 school years. ** Only two educators received an Early Childhood license in 2024; neither individual was employed during the 2024-2025 school year. |
|||||
| License Effective 2020 (# of RE Licenses Obtained: 266) | License Effective 2021 (# of RE Licenses Obtained: 217) | License Effective 2022 (# of RE Licenses Obtained: 165) | License Effective 2023 (# of RE Licenses Obtained: 236) | License Effective 2024 (# of RE Licenses Obtained: 231) | ||||||||
|---|---|---|---|---|---|---|---|---|---|---|---|---|
| District Type | Employed SY | n | % | n | % | n | % | n | % | n | % | Total (N) |
| Community School | 2020-21 | 9 | 7% | - | - | - | - | - | - | - | - | 9 |
| 2021-22 | 9 | 6% | 7 | 5% | - | - | - | - | - | - | 16 | |
| 2022-23 | 8 | 5% | 7 | 5% | 6 | 6% | - | - | - | - | 21 | |
| 2023-24 | 8 | 5% | 5 | 4% | 6 | 6% | 6 | 4% | - | - | 25 | |
| 2024-25 | - | - | 4 | 3% | 6 | 6% | 6 | 4% | 6 | 4% | 22 | |
| Educational Service Center | 2020-21 | 0 | 0% | - | - | - | - | - | - | - | - | 0 |
| 2021-22 | 1 | 1% | 1 | 1% | - | - | - | - | - | - | 2 | |
| 2022-23 | 0 | 0% | 1 | 1% | 0 | 0% | - | - | - | - | 1 | |
| 2023-24 | 0 | 0% | 0 | 0% | 0 | 0% | 0 | 0% | - | - | 0 | |
| 2024-25 | - | - | 0 | 0% | 0 | 0% | 0 | 0% | 0 | 0% | 0 | |
| Joint Vocational School District | 2020-21 | 0 | 0% | - | - | - | - | - | - | - | - | 0 |
| 2021-22 | 0 | 0% | 0 | 0% | - | - | - | - | - | - | 0 | |
| 2022-23 | 0 | 0% | 0 | 0% | 2 | 2% | - | - | - | - | 2 | |
| 2023-24 | 0 | 0% | 1 | 1% | 0 | 0% | 0 | 0% | - | - | 1 | |
| 2024-25 | - | - | 1 | 1% | 0 | 0% | 0 | 0% | 0 | 0% | 1 | |
| Public District | 2020-21 | 119 | 93% | - | - | - | - | - | - | - | - | 119 |
| 2021-22 | 148 | 94% | 131 | 94% | - | - | - | - | - | - | 279 | |
| 2022-23 | 150 | 95% | 137 | 94% | 89 | 92% | - | - | - | - | 376 | |
| 2023-24 | 141 | 95% | 133 | 96% | 99 | 94% | 162 | 96% | - | - | 535 | |
| 2024-25 | - | - | 125 | 96% | 93 | 94% | 161 | 96% | 151 | 96% | 530 | |
| Science, Technology, Engineering, and Mathematics | 2020-21 | 0 | 0% | - | - | - | - | - | - | - | - | 0 |
| 2021-22 | 0 | 0% | 0 | 0% | - | - | - | - | - | - | 0 | |
| 2022-23 | 0 | 0% | 0 | 0% | 0 | 0% | - | - | - | - | 0 | |
| 2023-24 | 0 | 0% | 0 | 0% | 0 | 0% | 1 | 1% | - | - | 1 | |
| 2024-25 | - | - | 0 | 0% | 0 | 0% | 1 | 1% | 0 | 0% | 1 | |
| Total | 2020-21 | 128 | 100% | - | - | - | - | - | - | - | - | 128 |
| 2021-22 | 158 | 100% | 139 | 100% | - | - | - | - | - | - | 297 | |
| 2022-23 | 158 | 100% | 145 | 100% | 97 | 100% | - | - | - | - | 400 | |
| 2023-24 | 149 | 100% | 139 | 100% | 105 | 100% | 169 | 100% | - | - | 562 | |
| 2024-25 | - | - | 130 | 100% | 99 | 100% | 168 | 100% | 157 | 100% | 554 | |
| Note. District type data were obtained from OEDS. Data in this table reflects the number of educator licenses, not the number of educators. Educators may hold more than one valid license. | ||||||||||||
| License Effective 2020 (# of RE Licenses Obtained: 256) | License Effective 2021 (# of RE Licenses Obtained: 217) | License Effective 2022 (# of RE Licenses Obtained: 165) | License Effective 2023 (# of RE Licenses Obtained: 236) | License Effective 2024 (# of RE Licenses Obtained: 231) | ||||||||
|---|---|---|---|---|---|---|---|---|---|---|---|---|
| District Setting | Employed SY | n | % | n | % | n | % | n | % | n | % | Total (N) |
| Rural (1,2) | 2020-21 | 7 | 8% | - | - | - | - | - | - | - | - | 16 |
| 2021-22 | 9 | 6% | 5 | 4% | - | - | - | - | - | - | 23 | |
| 2022-23 | 9 | 6% | 7 | 5% | 6 | 7% | - | - | - | - | 32 | |
| 2023-24 | 10 | 7% | 6 | 5% | 7 | 7% | 16 | 10% | - | - | 39 | |
| 2024-25 | - | - | 5 | 4% | 7 | 8% | 16 | 10% | 17 | 11% | 45 | |
| Small Town (3,4) | 2020-21 | 18 | 15% | - | - | - | - | - | - | - | - | 35 |
| 2021-22 | 22 | 15% | 12 | 9% | - | - | - | - | - | - | 48 | |
| 2022-23 | 25 | 27% | 16 | 12% | 14 | 16% | - | - | - | - | 67 | |
| 2023-24 | 20 | 24% | 12 | 9% | 13 | 13% | 14 | 9% | - | - | 59 | |
| 2024-25 | - | - | 13 | 10% | 10 | 11% | 18 | 11% | 20 | 13% | 61 | |
| Suburban (5,6) | 2020-21 | 51 | 43% | - | - | - | - | - | - | - | - | 126 |
| 2021-22 | 62 | 42% | 54 | 41% | - | - | - | - | - | - | 190 | |
| 2022-23 | 65 | 43% | 57 | 42% | 43 | 48% | - | - | - | - | 244 | |
| 2023-24 | 69 | 49% | 59 | 44% | 51 | 52% | 82 | 51% | - | - | 261 | |
| 2024-25 | - | - | 58 | 46% | 51 | 55% | 83 | 52% | 69 | 46% | 261 | |
| Urban (7,8) | 2020-21 | 43 | 36% | - | - | - | - | - | - | - | - | 88 |
| 2021-22 | 55 | 37% | 60 | 46% | - | - | - | - | - | - | 168 | |
| 2022-23 | 51 | 34% | 57 | 42% | 26 | 29% | - | - | - | - | 183 | |
| 2023-24 | 42 | 30% | 59 | 44% | 28 | 28% | 50 | 31% | - | - | 176 | |
| 2024-25 | - | - | 49 | 39% | 25 | 27% | 44 | 27% | 45 | 30% | 163 | |
| Total | 2020-21 | 119 | 100% | - | - | - | - | - | - | - | - | 265 |
| 2021-22 | 148 | 100% | 131 | 100% | - | - | - | - | - | - | 429 | |
| 2022-23 | 150 | 100% | 137 | 100% | 89 | 100% | - | - | - | - | 526 | |
| 2023-24 | 141 | 100% | 133 | 100% | 99 | 100% | 162 | 100% | - | - | 535 | |
| 2024-25 | - | - | 125 | 100% | 93 | 100% | 161 | 100% | 151 | 100% | 125 | |
| Note. District typology data were obtained from DEW’s 2013 school district typology data. Data in this table reflects the number of educator licenses, not the number of educators. Educators may hold more than one valid license. | ||||||||||||
| License Effective 2020 (# of RE Licenses Obtained: 256) | License Effective 2021 (# of RE Licenses Obtained: 217) | License Effective 2022 (# of RE Licenses Obtained: 165) | License Effective 2023 (# of RE Licenses Obtained: 236) | License Effective 2024 (# of RE Licenses Obtained: 231) | ||||||||
|---|---|---|---|---|---|---|---|---|---|---|---|---|
| District Region Cluster | Employed SY | n | % | n | % | n | % | n | % | n | % | Total (N) |
| Northwest Ohio | 2020-21 | 7 | 6% | - | - | - | - | - | - | - | - | 7 |
| 2021-22 | 5 | 3% | 3 | 2% | - | - | - | - | - | - | 8 | |
| 2022-23 | 7 | 4% | 4 | 3% | 4 | 4% | - | - | - | - | 15 | |
| 2023-24 | 6 | 4% | 4 | 3% | 2 | 2% | 5 | 3% | - | - | 17 | |
| 2024-25 | - | - | 4 | 3% | 2 | 2% | 7 | 4% | 6 | 4% | 19 | |
| Northeast Ohio | 2020-21 | 8 | 7% | - | - | - | - | - | - | - | - | 8 |
| 2021-22 | 9 | 6% | 11 | 8% | - | - | - | - | - | - | 20 | |
| 2022-23 | 8 | 5% | 11 | 8% | 5 | 5% | - | - | - | - | 24 | |
| 2023-24 | 12 | 8% | 10 | 7% | 6 | 6% | 7 | 4% | - | - | 35 | |
| 2024-25 | - | - | 10 | 8% | 6 | 6% | 5 | 3% | 7 | 4% | 28 | |
| Central-west Ohio | 2020-21 | 18 | 15% | - | - | - | - | - | - | - | - | 18 |
| 2021-22 | 23 | 15% | 15 | 10% | - | - | - | - | - | - | 38 | |
| 2022-23 | 20 | 13% | 16 | 11% | 10 | 11% | - | - | - | - | 46 | |
| 2023-24 | 16 | 11% | 17 | 12% | 16 | 15% | 18 | 11% | - | - | 67 | |
| 2024-25 | - | - | 14 | 11% | 12 | 12% | 16 | 10% | 19 | 12% | 61 | |
| Central Ohio | 2020-21 | 6 | 5% | - | - | - | - | - | - | - | - | 6 |
| 2021-22 | 13 | 8% | 14 | 10% | - | - | - | - | - | - | 27 | |
| 2022-23 | 17 | 11% | 9 | 6% | 13 | 14% | - | - | - | - | 39 | |
| 2023-24 | 18 | 12% | 10 | 7% | 14 | 13% | 23 | 14% | - | - | 65 | |
| 2024-25 | - | - | 10 | 8% | 12 | 12% | 16 | 10% | 19 | 12% | 68 | |
| Central-east Ohio | 2020-21 | 2 | 2% | - | - | - | - | - | - | - | - | 2 |
| 2021-22 | 2 | 1% | 1 | 1% | - | - | - | - | - | - | 3 | |
| 2022-23 | 2 | 1% | 1 | 1% | 0 | 0% | - | - | - | - | 3 | |
| 2023-24 | 2 | 1% | 1 | 1% | 0 | 0% | 1 | 1% | - | - | 4 | |
| 2024-25 | - | - | 1 | 1% | 0 | 0% | 1 | 1% | 0 | 0% | 2 | |
| Southwest Ohio | 2020-21 | 80 | 66% | - | - | - | - | - | - | - | - | 80 |
| 2021-22 | 104 | 66% | 99 | 69% | - | - | - | - | - | - | 203 | |
| 2022-23 | 103 | 65% | 101 | 70% | 62 | 65% | - | - | - | - | 266 | |
| 2023-24 | 95 | 64% | 95 | 68% | 66 | 63% | 115 | 68% | - | - | 371 | |
| 2024-25 | - | - | 89 | 68% | 66 | 67% | 116 | 69 | 100 | 64% | 371 | |
| Southeast Ohio | 2020-21 | 1 | 1% | - | - | - | - | - | - | - | - | 1 |
| 2021-22 | 1 | 1% | 0 | 0% | - | - | - | - | - | - | 1 | |
| 2022-23 | 1 | 1% | 2 | 1% | 1 | 1% | - | - | - | - | 4 | |
| 2023-24 | 0 | 0% | 2 | 1% | 1 | 1% | 0 | 0% | - | - | 3 | |
| 2024-25 | - | - | 2 | 2% | 1 | 1% | 0 | 0% | 2 | 1% | 5 | |
| Total | 2020-21 | 122 | 100% | - | - | - | - | - | - | - | - | 122 |
| 2021-22 | 157 | 100% | 143 | 100% | - | - | - | - | - | - | 300 | |
| 2022-23 | 158 | 100% | 144 | 100% | 95 | 100% | - | - | - | - | 397 | |
| 2023-24 | 149 | 100% | 139 | 100% | 105 | 100% | 169 | 100% | - | - | 562 | |
| 2024-25 | - | - | 130 | 100% | 99 | 100% | 168 | 100% | 157 | 100% | 554 | |
| Note. District regions were obtained from DEW’s report card data for SY 2023-2024. Data in this table reflects the number of educator licenses, not the number of educators. Educators may hold more than one valid license. | ||||||||||||
| License Effective 2020 (# of RE Licenses Obtained: 256) | License Effective 2021 (# of RE Licenses Obtained: 217) | License Effective 2022 (# of RE Licenses Obtained: 165) | License Effective 2023 (# of RE Licenses Obtained: 236) | License Effective 2024 (# of RE Licenses Obtained: 231) | ||||||||
|---|---|---|---|---|---|---|---|---|---|---|---|---|
| High-Need Building | Employed SY | n | % | n | % | n | % | n | % | n | % | Total (N) |
| Yes | 2020-21 | 56 | 38% | 52 | 43% | - | - | - | - | - | - | 52 |
| 2021-22 | 63 | 42% | 65 | 42% | 74 | 56% | - | - | - | - | 139 | |
| 2022-23 | 61 | 40% | 65 | 42% | 71 | 50% | 41 | 44% | - | - | 177 | |
| 2023-24 | - | - | 76 | 53% | 84 | 61% | 50 | 49% | 79 | 48% | 289 | |
| 20124-25 | - | - | 77 | 61% | 54 | 55% | 86 | 52% | 79 | 53% | 296 | |
| Total | 2020-21 | 122 | 100% | - | - | - | - | - | - | - | - | 122 |
| 2021-22 | 154 | 100% | 131 | 100% | - | - | - | - | - | - | 285 | |
| 2022-23 | 154 | 100% | 141 | 100% | 94 | 100% | - | - | - | - | 389 | |
| 2023-24 | 144 | 100% | 137 | 100% | 102 | 100% | 166 | 100% | - | - | 549 | |
| 2024-25 | - | - | 127 | 100% | 98 | 100% | 165 | 100% | 149 | 100% | 539 | |
| Note. High-need schools were defined as (1) elementary schools with at least 60% of students who were considered economically disadvantaged; and (2) all other types of schools with at least 45% of students who were considered economically disadvantaged. Economic disadvantage data were obtained from DEW’s school-level report card data. School type data were obtained from OEDS. Data in this table reflect the number of educator licenses and positions at school level not the number of educators. Educators may hold more than one valid license and/or be employed in multiple schools. | ||||||||||||
| Educator Group | High Minority | Medium-High Minority | Medium-Low Minority | Low Minority | No Minority |
|---|---|---|---|---|---|
| MU Graduates (N=202) |
41 (20%) | 95 (47%) | 42 (21%) | 23 (11%) | 1 (0.5%) |
| Statewide RE License Holding Educators (N=2,848) |
476 (17%) | 952 (33%) | 757 (27%) | 645 (23%) | 18 (1%) |
| Note. Percentages may be less than or greater than 100% due to rounding. | |||||
| Educator Group | High Poverty | Medium-High Poverty | Medium-Low Poverty | Low Poverty | No Poverty |
|---|---|---|---|---|---|
| MU Graduates (N=202) |
43 (21%) | 40 (20%) | 48 (24%) | 70 (35%) | 1 (0.5%) |
| Statewide RE License Holding Educators (N=2,848) |
672 (24%) | 630 (22%) | 778 (27%) | 750 (26%) | 18 (1%) |
| Note. Percentages may be less than or greater than 100% due to rounding. | |||||
| Baseline (Licensed 2020, Employed in Ohio in SY 2020–21) | % Employed in Ohio in SY 2021-22 | % Employed in Ohio in SY 2022-23 | % Employed in Ohio in SY 2023-24 | ||||
|---|---|---|---|---|---|---|---|
| Licensure Type | n | n | % | n | % | n | % |
| Early Childhood (P-3) | 32 | 29 | 91% | 28 | 88% | 28 | 88% |
| Middle Childhood (4-9) | 22 | 22 | 100% | 21 | 95% | 19 | 86% |
| Adolescence to Young Adult (7-12) | 29 | 27 | 93% | 26 | 90% | 23 | 79% |
| Multi Age (P-12) | 20 | 18 | 90% | 17 | 85% | 13 | 65% |
| Intervention Specialist (K-12) | 27 | 24 | 89% | 22 | 81% | 20 | 74% |
| Total | 130 | 120 | 92% | 114 | 88% | 103 | 79% |
| Note. This retention analysis was based on teachers’ employment data sets for SYs 2020-21, 2021-22, 2022-23, and 2023-24. Data in this table reflect the number of educator licenses, not the number of educators. Educators may hold more than one valid license. | |||||||
| Baseline (Licensed 2021, Employed in Ohio in SY 2021–22) | % Employed in Ohio in SY 2022-23 | % Employed in Ohio in SY 2023-24 | % Employed in Ohio in SY 2024-25 | ||||
|---|---|---|---|---|---|---|---|
| Licensure Type | n | n | % | n | % | n | % |
| Early Childhood (P-3) | 47 | 41 | 87% | 38 | 81% | 37 | 79% |
| Middle Childhood (4-9) | 24 | 21 | 88% | 18 | 75% | 16 | 67% |
| Adolescence to Young Adult (7-12) | 36 | 32 | 89% | 29 | 81% | 26 | 72% |
| Multi Age (P-12) | 14 | 9 | 64% | 8 | 57% | 8 | 57% |
| Intervention Specialist (K-12) | 23 | 22 | 96% | 23 | 100% | 20 | 87% |
| Total | 144 | 125 | 87% | 116 | 81% | 107 | 74% |
| Note. This retention analysis was based on teachers’ employment data sets for SYs 2021-22, 2022-23, 2023-24, and 2024-25. Data in this table reflect the number of educator licenses, not the number of educators. Educators may hold more than one valid license. | |||||||
| Baseline (Licensed 2022, Employed in Ohio in SY 2022–23) | % Employed in Ohio in SY 2023-24 | % Employed in Ohio in SY 2024-25 | |||
|---|---|---|---|---|---|
| Licensure Type | n | n | % | n | % |
| Early Childhood (P-3) | 24 | 23 | 96% | 20 | 83% |
| Middle Childhood (4-9) | 8 | 8 | 100% | 8 | 100% |
| Adolescence to Young Adult (7-12) | 24 | 21 | 88% | 20 | 83% |
| Multi Age (P-12) | 11 | 11 | 100% | 10 | 91% |
| Intervention Specialist (K-12) | 19 | 17 | 89% | 17 | 89% |
| Primary (P-5) | 11 | 10 | 91% | 8 | 73% |
| Total | 97 | 90 | 93% | 83 | 86% |
| Note. This retention analysis was based on teachers’ employment data sets for SYs 2022-23, 2023-24, and 2024-25. Data in this table reflect the number of educator licenses, not the number of educators. Educators may hold more than one valid license. | |||||
| Baseline (Licensed 2023, Employed in Ohio in SY 2023–24) | % Employed in Ohio in SY 2024-25 | ||
|---|---|---|---|
| Licensure Type | n | n | % |
| Early Childhood (P-3) | 1 | 1 | 100% |
| Middle Childhood (4-9) | 24 | 23 | 96% |
| Adolescence to Young Adult (7-12) | 37 | 34 | 92% |
| Multi Age (P-12) | 21 | 20 | 95% |
| Intervention Specialist (K-12) | 21 | 18 | 86% |
| Primary (P-5) | 65 | 59 | 91% |
| Total | 169 | 155 | 92% |
| Note. This retention analysis was based on teachers’ employment data sets for SYs 2023-24 and 2024-25. Data in this table reflect the number of educator licenses, not the number of educators. Educators may hold more than one valid license. | |||
Miami Graduates Employed in Ohio with Principal Licenses
In SY 2024-2025, 21 Miami graduates holding principal credentials were employed with an Assistant Principal Assignment and two were employed with a Principal Assignment (Table 18).
| Position Category | Position Description | Employed SY | License Effective Year 2020 | License Effective Year 2021 | License Effective Year 2022 | License Effective Year 2023 | License Effective Year 2024 | Total |
|---|---|---|---|---|---|---|---|---|
| Principals | Assistant Principal Assignment | 2020-21 | 1 | - | - | - | - | 1 |
| 2021-22 | 5 | 2 | - | - | - | 7 | ||
| 2022-23 | 6 | 1 | 1 | - | - | 8 | ||
| 2023-24 | 9 | 2 | 3 | 3 | -- | 17 | ||
| 2024-25 | -- | 4 | 6 | 8 | 3 | 21 | ||
| Principal Assignment | 2020-21 | 0 | - | - | - | - | 0 | |
| 2021-22 | 0 | 1 | - | - | - | 1 | ||
| 2022-23 | 0 | 2 | 1 | - | - | 3 | ||
| 2023-24 | 1 | 2 | 0 | 0 | -- | 3 | ||
| 2024-25 | -- | 2 | 0 | 0 | 0 | 2 | ||
| Teachers | Teacher Assignment | 2020-21 | 22 | - | - | - | - | 22 |
| 2021-22 | 15 | 21 | - | - | - | 36 | ||
| 2022-23 | 14 | 21 | 12 | - | - | 47 | ||
| 2023-24 | 12 | 16 | 12 | 13 | -- | 53 | ||
| 2024-25 | -- | 19 | 12 | 11 | 16 | 58 | ||
| School counselors | Counseling Assignment | 2020-21 | 1 | - | - | - | - | 1 |
| 2021-22 | 1 | 0 | - | - | - | 1 | ||
| 2022-23 | 1 | 0 | 0 | - | - | 1 | ||
| 2023-24 | 1 | 0 | 0 | 2 | -- | 3 | ||
| 2024-25 | -- | 1 | 0 | 1 | 1 | 3 | ||
| School psychologists | Psychologist Assignment | 2020-21 | 0 | - | - | - | - | 0 |
| 2021-22 | 0 | 0 | - | - | - | 0 | ||
| 2022-23 | 0 | 0 | 0 | - | - | 0 | ||
| 2023-24 | 0 | 0 | 0 | 1 | -- | 1 | ||
| 2024-25 | -- | 1 | 0 | 1 | 0 | 2 | ||
| Student Support Specialists | Remedial Specialist Assignment | 2020-21 | 1 | - | - | - | - | 1 |
| 2021-22 | 1 | 0 | - | - | - | 1 | ||
| 2022-23 | 0 | 2 | 5 | - | - | 7 | ||
| 2023-24 | 0 | 4 | 4 | 2 | -- | 10 | ||
| 2024-25 | -- | 0 | 5 | 2 | 0 | 7 | ||
| Supplemental Service Teaching Assignment (Serves Students with Disability Conditions Only) | 2020-21 | 3 | - | - | - | - | 3 | |
| 2021-22 | 2 | 3 | - | - | - | 5 | ||
| 2022-23 | 1 | 3 | 6 | - | - | 10 | ||
| 2023-24 | 0 | 3 | 6 | 7 | -- | 16 | ||
| 2024-25 | -- | 3 | 5 | 5 | 0 | 13 | ||
| Other | Advisor Assignment | 2020-21 | 4 | - | - | - | - | 4 |
| 2021-22 | 2 | 3 | - | - | - | 5 | ||
| 2022-23 | 2 | 4 | 8 | - | - | 14 | ||
| 2023-24 | 4 | 3 | 8 | 5 | -- | 20 | ||
| 2024-25 | -- | 5 | 2 | 3 | 1 | 11 | ||
| Coaching Assignment | 2020-21 | 9 | - | - | - | - | 9 | |
| 2021-22 | 7 | 2 | - | - | - | 9 | ||
| 2022-23 | 7 | 3 | 2 | - | - | 12 | ||
| 2023-24 | 5 | 3 | 2 | 3 | -- | 13 | ||
| 2024-25 | -- | 4 | 1 | 3 | 0 | 8 | ||
| Coordinator Assignment | 2020-21 | 0 | - | - | - | - | 0 | |
| 2021-22 | 1 | 0 | - | - | - | 1 | ||
| 2022-23 | 1 | 0 | 2 | - | - | 3 | ||
| 2023-24 | 1 | 1 | 2 | 0 | -- | 4 | ||
| 2024-25 | -- | 2 | 0 | 1 | 0 | 3 | ||
| Curriculum Specialist Assignment | 2020-21 | 3 | - | - | - | - | 3 | |
| 2021-22 | 4 | 0 | - | - | - | 4 | ||
| 2022-23 | 4 | 0 | 1 | - | - | 5 | ||
| 2023-24 | 3 | 0 | 0 | 0 | -- | 3 | ||
| 2024-25 | -- | 0 | 1 | 0 | 0 | 1 | ||
| Director Assignment | 2020-21 | 0 | - | - | - | - | 0 | |
| 2021-22 | 0 | 0 | - | - | - | 0 | ||
| 2022-23 | 0 | 0 | 0 | - | - | 0 | ||
| 2023-24 | 0 | 0 | 0 | 1 | -- | 1 | ||
| 2024-25 | -- | 1 | 1 | 1 | 0 | 3 | ||
| Other Extra/Intra Curricular Activities Assignment | 2020-21 | 10 | - | - | - | - | 10 | |
| 2021-22 | 4 | 1 | - | - | - | 5 | ||
| 2022-23 | 2 | 1 | 4 | - | - | 7 | ||
| 2023-24 | 1 | 1 | 2 | 2 | -- | 6 | ||
| 2024-25 | -- | 3 | 2 | 5 | 1 | 11 | ||
| Other Official/Administrative Assignment | 2020-21 | 1 | - | - | - | - | 1 | |
| 2021-22 | 0 | 0 | - | - | - | 0 | ||
| 2022-23 | 0 | 0 | 2 | - | - | 2 | ||
| 2023-24 | 0 | 0 | 2 | 1 | -- | 3 | ||
| 2024-25 | -- | 0 | 2 | 0 | 1 | 3 | ||
| Other Professional-Educational Assignment | 2020-21 | 2 | - | - | - | - | 2 | |
| 2021-22 | 1 | 1 | - | - | - | 2 | ||
| 2022-23 | 2 | 0 | 2 | - | - | 4 | ||
| 2023-24 | 2 | 0 | 4 | 0 | -- | 6 | ||
| 2024-25 | -- | 0 | 1 | 0 | 0 | 1 | ||
| Other Professional-Other Assignment | 2020-21 | 1 | - | - | - | - | 1 | |
| 2021-22 | 1 | 0 | - | - | - | 1 | ||
| 2022-23 | 0 | 0 | 0 | - | - | 0 | ||
| 2023-24 | 0 | 0 | 0 | 0 | -- | 0 | ||
| 2024-25 | - | 0 | 0 | 0 | 0 | 0 | ||
| Social Work Assignment | 2020-21 | 0 | - | - | - | - | 0 | |
| 2021-22 | 0 | 0 | - | - | - | 0 | ||
| 2022-23 | 0 | 0 | 0 | - | - | 0 | ||
| 2023-24 | 0 | 0 | 0 | 0 | -- | 0 | ||
| 2024-25 | -- | 0 | 0 | 0 | 1 | 1 | ||
| Speech and Language Therapist Assignment | 2020-21 | 0 | - | - | - | - | 0 | |
| 2021-22 | 0 | 0 | - | - | - | 0 | ||
| 2022-23 | 0 | 0 | 1 | - | - | 1 | ||
| 2023-24 | 0 | 0 | 0 | 0 | -- | 0 | ||
| 2024-25 | - | 0 | 0 | 0 | 0 | 0 | ||
| Supervisor/Manager Assignment | 2020-21 | 0 | - | - | - | - | 0 | |
| 2021-22 | 0 | 1 | - | - | - | 1 | ||
| 2022-23 | 0 | 1 | 0 | - | - | 1 | ||
| 2023-24 | 0 | 1 | 0 | 0 | -- | 1 | ||
| 2024-25 | -- | 0 | 1 | 0 | 0 | 1 | ||
| Teacher Mentor/Evaluator Assignment | 2020-21 | 0 | - | - | - | - | 0 | |
| 2021-22 | 0 | 0 | - | - | - | 0 | ||
| 2022-23 | 0 | 0 | 0 | - | - | 0 | ||
| 2023-24 | 0 | 1 | 1 | 0 | -- | 2 | ||
| 2024-25 | -- | 1 | 0 | 0 | 0 | 1 | ||
| Tutor/Small Group Instructor Assignment (Serves Students Without Disability Conditions Only) | 2020-21 | 0 | - | - | - | - | 0 | |
| 2021-22 | 0 | 1 | - | - | - | 1 | ||
| 2022-23 | 0 | 1 | 0 | - | - | 1 | ||
| 2023-24 | 0 | 1 | 0 | 0 | -- | 1 | ||
| 2024-25 | -- | 0 | 2 | 0 | 0 | 2 | ||
| Dean of Students | 2020-21 | 0 | - | - | - | - | 0 | |
| 2021-22 | 0 | 0 | - | - | - | 0 | ||
| 2022-23 | 0 | 0 | 2 | - | - | 2 | ||
| 2023-24 | 0 | 0 | 3 | 0 | -- | 3 | ||
| 2024-25 | -- | 0 | 1 | 0 | 1 | 2 | ||
| Planning/Research/Development/Evaluation/Analysis Assignment | 2020-21 | - | - | - | - | - | 0 | |
| 2021-22 | - | - | - | - | - | 0 | ||
| 2022-23 | - | - | - | - | - | 0 | ||
| 2023-24 | 0 | 1 | 0 | 0 | -- | 1 | ||
| 2024-25 | -- | 0 | 1 | 0 | 0 | 1 | ||
| Total | 2020-21 | 58 | - | - | - | - | 58 | |
| 2021-22 | 44 | 36 | - | - | - | 80 | ||
| 2022-23 | 40 | 39 | 49 | - | - | 128 | ||
| 2023-24 | 39 | 39 | 49 | 40 | -- | 167 | ||
| 2024-25 | - | 46 | 43 | 41 | 25 | 155 | ||
| Note. Graduates with principal licenses may have worked in more than one position. | ||||||||
College of Education, Health, and Society
210 E. Spring St.
Oxford, OH 45056


